ChartGPT
By ChartGPT
Intelligent literature review and research synthesis copilot for scholars.
Overview
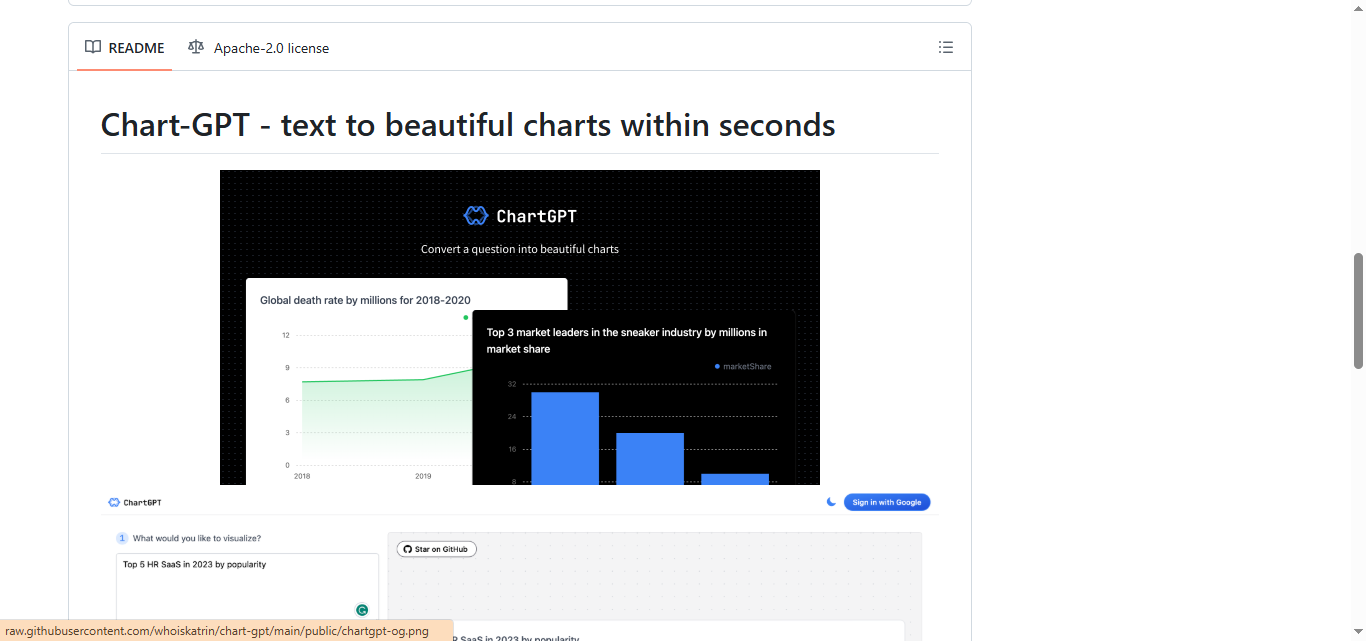
Summary: ChartGPT is an AI-powered data visualization and table analysis tool that converts plain text prompts, uploaded spreadsheets, and image uploads into interactive, customizable charts.
What is ChartGPT?ChartGPT acts as a natural language data visualization engine built to eliminate manual chart building in spreadsheet applications.
Users can describe the data they want to see, upload raw .csv files or spreadsheets, or even upload photos of printed tables. Powered by large language models, ChartGPT parses tabular data, suggests appropriate chart types (e.g., bar, line, pie, area), builds fully editable visualizations in the browser, and exports underlying code (such as Vega-Lite, Python, or JavaScript) for developers.
Verifiable Stats:
-
Core Capability: Text-to-chart generation, tabular image OCR to spreadsheet conversion, data summarization, and data visualization code generation.
-
Key Workflows: Converting uploaded
.csvtables into interactive visual charts, digitizing paper tables into editable spreadsheets, generating data analysis scripts, and writing executive summaries. -
Target Audience: Data analysts, marketers, students, software developers, and business professionals seeking instant visual insights.
-
Processing Workflow: Frontend interactive chart editor backed by natural language processing and computer vision engines that calculate tokens and execute code outputs.
-
Pricing Model: Credit-based usage with a free trial tier, monthly subscription packages (e.g., $2.99–$14.99/mo), and flexible pay-as-you-go options.
Screenshots & Demo
Key Features
Core capabilities and functionalities provided by ChartGPT.
Semantic Literature Synthesis & Extraction
Extracts core scientific methodologies, empirical findings, and dataset conclusions across hundreds of academic papers.
Interactive Citation Network & Consensus Mapping
Maps paper relationships, identifies seminal research works, and verifies whether follow-up literature supports or challenges claims.
Conversational PDF & Document Grounding
Allows users to chat with dense research papers, technical specs, and financial filings with exact page-level source citations.
Automated Fact-Checking & Evidence Auditing
Cross-references statements against peer-reviewed studies to minimize hallucinations and ensure publication-grade rigor.
Pros & Cons
Key strengths and potential limitations of ChartGPT.
What We Like
- Eliminates manual chart building by converting plain text descriptions instantly into polished visual graphics
- Excellent OCR capability that converts photos of physical paper tables into editable digital spreadsheets.
- Generates clean, reusable graphing code across multiple programming languages (Python, JavaScript, R, MATLAB).
- Flexible credit-based pricing with pay-as-you-go options that cater to light and occasional users.
- Supports full browser-based chart customization, including title edits, legend toggles, and chart type switching
Where It Falls Short
- Complex multi-tab or relational enterprise databases still require manual pre-formatting before uploading.
- Highly specialized statistical chart types (e.g., 3D surface plots or complex geospatial heatmaps) are limited
- Credit balance consumption can accelerate quickly when running large batches of high-resolution table image scans.
- Image-to-table OCR accuracy drops on blurry photos, handwritten notes, or heavily distorted text documents.
- Open-source versions require users to manage their own OpenAI API key and server configurations.
Use Cases
Discover common workflows and scenarios where ChartGPT excels.
Text-to-Chart Generation
Type a prompt describing a data trend or dataset to automatically construct line, bar, pie, or scatter charts within seconds.
CSV & Spreadsheet Visualization
Upload raw .csv or Excel datasets to automatically generate editable browser charts and identify statistical trends.
Photo of Table to Spreadsheet (OCR)
Take a picture or screenshot of a printed data table to convert it into clean, editable data in Excel or Google Sheets.
Natural Language Data Summarization
Ask questions about uploaded datasets in plain English to receive automated executive summaries highlighting top performers and declining metrics.
Charting Code Generation
Export underlying graphing code in Python, R, JavaScript, or MATLAB to integrate charts directly into custom web applications or data pipelines.
Interactive Chart Editing
Adjust chart types, legends, color schemes, axes titles, and layout properties directly in the web app without losing underlying data.
Multilingual Querying & Translation
Ask questions and analyze complex datasets in any language, receiving translated chart summaries and structured answers.
Open-Source Developer Integration
Leverage open-source GitHub repositories based on Vega-Lite and React to build self-hosted chart generation apps.
Similar AI Tools

Writesonic
AI Writing Assistant & SEO Content Generator for Growth Teams

Grammarly
AI-Powered Writing Assistant & Real-Time Editing Tool

Humanizer
Make AI text sound natural and human

Sudowrite
AI Writing Partner Built Specifically for Fiction and Creative Writers

Copy-AI
GTM AI Platform for Marketing & Sales Automation

Frase
AI-Powered SEO Content Research, Writing & Optimization Platform

Hummanizer
Transform AI-generated text into natural, human-like writing

Worldtune
AI Writing Assistant & Smart Paraphrasing Tool
Latest from Our Blog
Tips, tutorials and insights about AI tools and how to use them effectively.

ChatGPT for Brand Voice: Can It Sound Like You?

ChatGPT for Marketing: The Complete 2026 Guide

Best AI Tools for Real Estate Agents in 2026: Listings, Leads and Follow-Up